Stock Market Map on Vedomosti.ru
Vedomosti.ru, the web site of the Vedomosti business newspaper, now has a new tool for helping readers analyze the business world – a graphic map of the stock market. The map enables users to instantly evaluate the current condition of the Russian stock market, see overall trends as well as the activity of individual companies’ stocks.
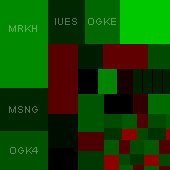
The map is composed of boxes or bars corresponding to various companies whose stocks are traded on the Moscow Central Stock Exchange. The color of any given bar indicates whether that company’s stocks are rising or falling that day. The size and area of the bar is proportionate to either the company’s capitalization or the volume of its shares traded on the MCSE that day.
By using the mouse to select a bar, a pop-up window appears with information about changes in that company’s share price, the volume of shares traded on the MCSE and its level of capitalization. By clicking on the bar, the user can receive either a share graph, a link to more information about the company or to publications about that company.
For greater ease of use, all companies are grouped according to their economic sector. The activity of each separate sector is shown for the most recent trading session.
The stock market map can be found at .